| contact us |
| why choose Chiralabs? |
Circular Dichroism Applications:
Protein Structure Analysis: Far-UV
Spectral Characteristics
In the far-UV wavelength region (170-260nm) the major chromophores generating CD features are the peptide linkages within the protein. Each peptide linkage has multiple electronic transitions through which it can absorb UV light, including nominally n→π* and π→π* transitions occurring around 210-220nm and 190nm respectively, each of which can contribute to the total CD spectrum.
The n→π* transition nominally involves the lone pair electrons (n) on the oxygen atom of the peptide link being
excited to the π* molecular orbital of the peptide link; as a formally electric transition dipole forbidden
transition it has a weak molar absorbance. In contrast, the π→π* transition is nominally from the occupied π
molecular orbital delocalised over the whole peptide link to the corresponding π* molecular orbital; formally this
is a electric transition dipole allowed transition and thus with an inherently stronger molar absorbance –
the source of exciton coupling described later. This is pictorially illustrated in the figure below.
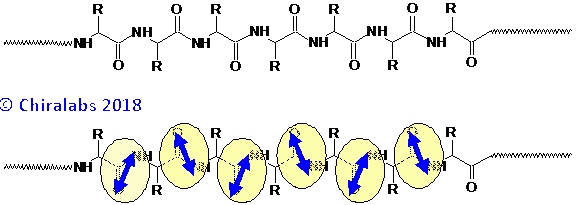
Crucially, there is exciton coupling between peptide chromophores that are nearby to each other, which is highly sensitive to the geometric arrangements and orientations of the peptides in 3-dimensional space. This coupling gives CD signals that are distinctive for different spatial arrangements and typically much enhanced in magnitude over that of the isolated individual chromophores, leading to the sensitivity of CD in the far-UV region to the overall 3-dimensional structure of the protein.
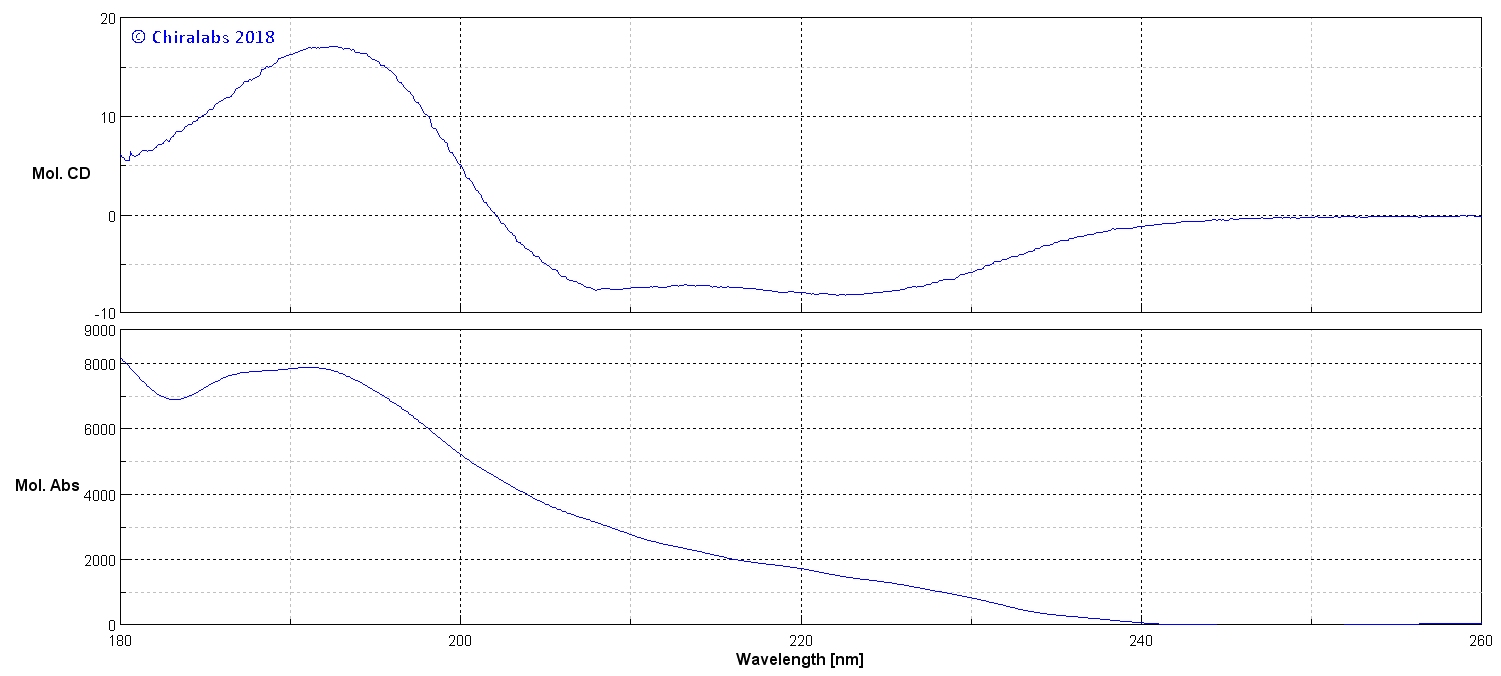
An example of the far-UV CD and absorption spectra of a protein is presented in the figure below as an illustration of some common aspects, in this case it is of a myoglobin, a protein with a 67% proportion of α-helix.
Solution & Spectroscopic Conditions
Given that molar absorbances tend to be greater at shorter wavelength, together with the preponderance of peptide linkages present in a protein, the total absorption from these chromophores can be substantial in the far-UV region. From basic spectroscopic principles, in order to obtain good quality spectra with high signal/noise ratios, it is optimal to have an absorbance of ca. 0.87AU at the wavelength(s) of interest, the range of 0.4 to 1.2AU being adequate in practice.
Individual peptide linkages have a molar absorbance of roughly 9000M-1cm-1 at 190nm for their π→π* transition (nb. this is somewhat dependent on structure, ranging from 4500 M-1cm-1 for peptides in ideal α-helices to 10000 M-1cm-1 for some convoluted structures). In practice this means a 1mg/ml protein solution in a 0.01cm pathlength cell is typically appropriate for far-UV CD down to 190nm and shorter wavelength; this would require ca. 50μl of solution for standard cells. As will be described later, judicious choice of pathlength allows stronger or weaker concentrations to be studied.
Generally it is preferable to extend the spectra to the shortest wavelength possible, so as to capture the maximum amount of spectral information representing the protein structures. However, if the spectra are, for whatever reason, to be constrained to wavelengths longer then 200nm then a proportionately higher concentration and/or longer pathlength should be used, as a peptide link n→π* molar absorbance around 220nm typically only amounts to ca. 2300M-1cm-1, a four-fold factor less than that of the π→π* transition.
Many buffer systems can be used as the media for protein solutions in the far-UV region, consistent with the requirement of being UV transparent. Phosphate (pH~7) and borate (pH~8.5) are particularly good, with tris, MOPS and sodium acetate being reasonable at lower concentrations (~10mM). Halide ions, especially iodide and bromide, can be problematic if present at high concentrations, but reasonable spectra can often be acquired from 1mg/ml protein solutions in, say, 10mM phosphate buffered saline.
The issue of buffer media absorption typically presents itself as a constraint as to how short a wavelength the spectra can be acquired down to and thus the level/quality of structural information elucidated, rather than causing a complete failure to obtain a spectrum. The user may therefore judge their priorities as to the level of spectroscopic information versus choice of buffer media. The use of other solvents, most notably trifluoroethanol, hexafluoropropanol, UV-grade acetonitrile and cyclohexane, that are ostensibly UV transparent down to below 190nm, is also an option. Many studies of short oligopeptides and membrane bound proteins have been undertaken in such solvents to simulate lipophillic environments and promote folding.
Fortunately, cells with pathlengths ranging from a nominal 0.001cm through to 10cm or more are available and, given the absorbance and CD follow a proportionality to pathlength (cf. Beer-Lambert rule), this opens up a broad range of concentrations that can be studied. For the far-UV region, CD spectra of 10mg/ml through to 0.1mg/ml can be readily investigated simply by judicious choice of pathlength cell; this range can be further extended in many cases with careful selection of conditions. For the cases where there is a paucity of sample available, specially formed micro-cells between focussing-expanding optics can be employed to facilitate the use of appropriate pathlengths.
Spectral Processing
Whatever the media, as with other CD and optical spectroscopy studies, as a first step a baseline spectrum of the media in the same cell under identical conditions should be acquired and subtracted from the sample spectrum to give the baseline corrected spectra.
At this point it is worth mentioning that, as an unfortunate historical hangover, most commercial CD spectrometers still output their CD spectra as an ellipticity (θ) in millidegree units by default. While perfectly correct, this is a description of the polarization state of the light having passed through the sample. We are more interested in the differential absorption of the circular polarized light by the sample that leads to this ellipticity. It is therefore more appropriate to discuss circular dichroism in delta absorption units (ΔA), which can be easily calculated from the ellipticity.
Thereafter, if possible, it is advisable to convert the CD and absorption spectra to a molar CD or molar absorbance basis, so as to normalise out concentration and pathlength dependence. As is appropriate for the far-UV region spectra of proteins and peptides, the molar circular dichroism (Δε) and molar absorbance spectra (ε), are calculated from the circular dichroism (ΔA) and absorbance (A) by division by the actual calibrated pathlength (ℓ in cm) and “mean peptide linkage” concentration of the protein; often "mean amino acid residue" concentration is employed instead of "mean peptide linkage" concentration and is almost interchangeable for large proteins.
For a protein of unknown amino acid composition it may be convenient to employ an average molecular weight per residue of ca. 111g/mol (for guidance, 1mg/ml of protein approximately equates to a mean peptide linkage concentration of ca. 9mM, although this obviously is dependent on the protein sequence).
Interpretation of FUV CD Spectra
Historically, the interpretation of CD spectra was based on a comparison with model polypeptides, such as polylysine, that adopted “pure” secondary structures (α-helices, β-sheets etc.) in certain solvent conditions. While of great utility for basic interpretation, these model cases did not wholly correspond to that actually found in natural proteins, whose secondary structures were a mixture of motifs and with vastly greater variety.
The figure below depicts some exemplar CD spectra for archetypal protein secondary structures - although these were deconvolved from a multitude of proteins as “average” examples of each structural type by a proprietary algorithm of Chiralabs. It must be stressed, as will be elaborated on below, these are still just examples; all of the structural motifs give subtly different spectral contributions dependent on their specific amino acid sequence, precise geometry and environment. Nonetheless, these archetypal spectra provide an adequate representation for preliminary interpretation.
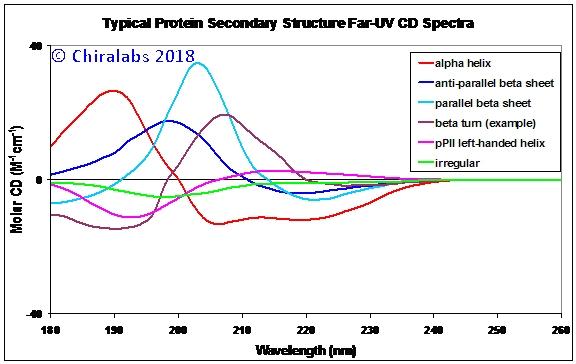
As can be seen, the α-helix can be distinguished by its two negative CD peaks at ca. 222 and 205nm together with a large positive peak at 190nm (note – negative going CD peaks are called negative maxima or peaks, not minima). This is consistent with the form of the above spectrum for myoglobin, a highly α-helical protein. In contrast the β-sheets are distinguished by a single negative CD peak at 217-220nm and a positive CD at 200-205nm.
Irregular structures are characterized by just a negative peak around 200nm, whereas polyproline-II (pPII) left handed helix has a similar negative feature but also a positive band at ca. 213nm. It is now well-established that many proteins have segments that adopt left-handed helical structures similar to pPII and that these may have important roles in protein behaviour. In earlier times, pPII structures were often misinterpreted as irregular but CD studies of thermal melting of the pPII to irregularity conclusively show their persistence as separate, stable conformers.
It may be noted that the irregular structure described in the figure corresponds to portions of irregularity in natively folded proteins; this is not necessarily the same as that which may occur during thermal or chemical denaturation – which also has a negative CD band, but typically somewhat shifted to shorter wavelength. This difference in part stems from whether it is i) irregular but static, ii) dynamically flexing and flitting through a range of structures or iii) a population of molecules, each with its own fixed but different conformation.
The CD spectrum for a β-turn in the figure is just one example out of many types of turns, but illustrates that these often overlooked structural features (in terms of CD analysis) actually can give substantial contributions rivaling those of the other classic regular helices and sheets and deserve to be better accounted for.
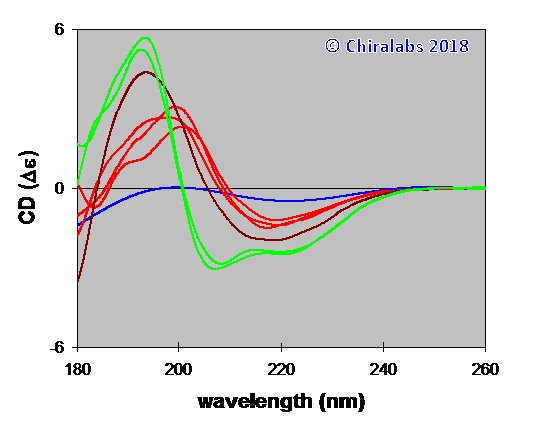
Even on these simplistic grounds, it is immediately apparent that far-UV CD is sensitive to secondary structure in an interpretable fashion. The figure below depicts an example of the far-UV CD of an aqueous solution of β-amyloid[1-40] in the presence of small amounts of a binding agent, where such a simplistic interpretation is quite sufficient to establish the structural changes occurring. It can be seen that three types of structure are adopted: the native structure (blue) through a β-sheet type structure (red) to an eventual α-helix based structure (green). This follows a pattern related to the natural aggregation of β-amyloid in vivo.
In many circumstances it is best to consider the CD spectrum as a structural fingerprint and use it in a comparative manner; a method for doing this objectively that has formed part of biopharmaceutical comparability studies is detailed in Bierau & Tranter (2010) and has been improved more recently (proprietary). In this role, CD can be very diagnostic and sensitive to structural changes; with precision measurements and care, subtle changes of 1% in spectral features can be discerned.
CD can also provide a rapid reality-check for protein modeling, able to establish whether purported protein structures from sequence homologies correspond to that observed in solution. In some cases it is even possible to reconstruct the structure of a protein by studying segments of its sequence by CD: recently, an elegant application of CD by Chiralabs to consecutive overlapping segments of a TNF protein has helped the identification of regions that induce necrosis in the native structure.
Interpretation of far-UV CD spectra in terms of absolute proportions of secondary structure can also be done, but over reliance on this can be misleading if care isn’t taken. While of value in trying to explore the basic features of a protein structure, one should be wary of placing too much faith in the “absolute” values of secondary structure as there are a variety of computational issues that need to be addressed and fully understood that impact on the accuracy of such interpretations.
Using the commonly available basis sets and algorithms, it is not unusual for absolute percentage proportions of α-helices to be judged to within 5% for known test cases, with this worsening to 10% or more for other structural types such as β-sheets and irregularity. With improvements such as developed by Chiralabs, this can be reduced to a few % in most cases, together with more detailed differentiation of structural types, including various turn motifs.
It is a feature of CD analysis that α-helices are inherently better distinguished and determined than other structural types, primarily due to their larger and more distinctive spectral contributions. The left panel of the figure below depicts a non-linear map of molar CD spectra of 23 diversely structured proteins, where it is clear that myoglobin is an outlier and the other proteins are compacted together with less distinction between them.
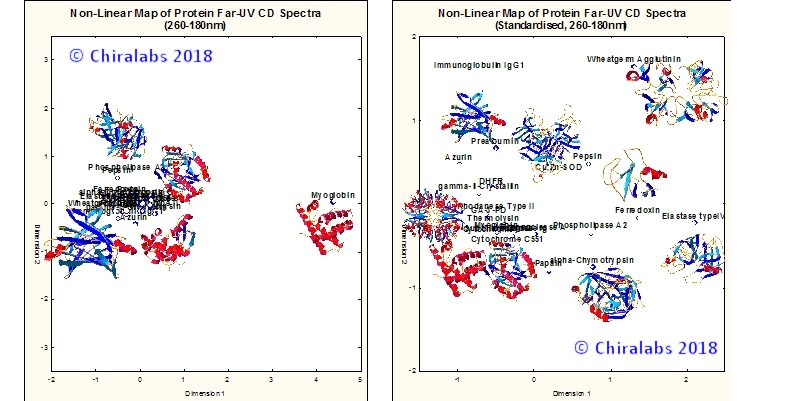
By applying a judicious spectral processing as depicted in the right panel of the figure, it can be clearly seen that the various structures can be more evenly distributed. In a sense, information about absolute magnitudes of features in CD spectra has been traded for greater consideration of spectral shape. Interestingly, while improving the determination of most secondary structure motifs, this approach doesn’t usually degrade the determination of α-helix significantly, as it still remains delineated from other structures, but now to a more balanced extent.
Chiralabs employs its proprietary algorithms and software to help extract the maximum information from CD spectra for our clients. Likewise, the use of our objective spectral comparability algorithm can be employed to provide faithful comparability studies.
- please contact us to see how we may enhance your analytical capabilities or help solve your analysis problems.
References
Bierau H, Tranter GE, Le Pevelen DD, Giartosio CE and Jone CS
Spectral Data Comparability–Acceptance Criteria Definition by Statistical Analysis. Encyclopedia of
Industrial Biotechnology: Bioprocess, Bioseparation, and Cell Technology, 2010,1–9.
For further literature see our Literature page